See the Market Through a Different Range.
Discover NIMIC Algo, an advanced algorithmic TradingView indicator designed to help traders analyze price movement through its multi-tiered visual range framework.
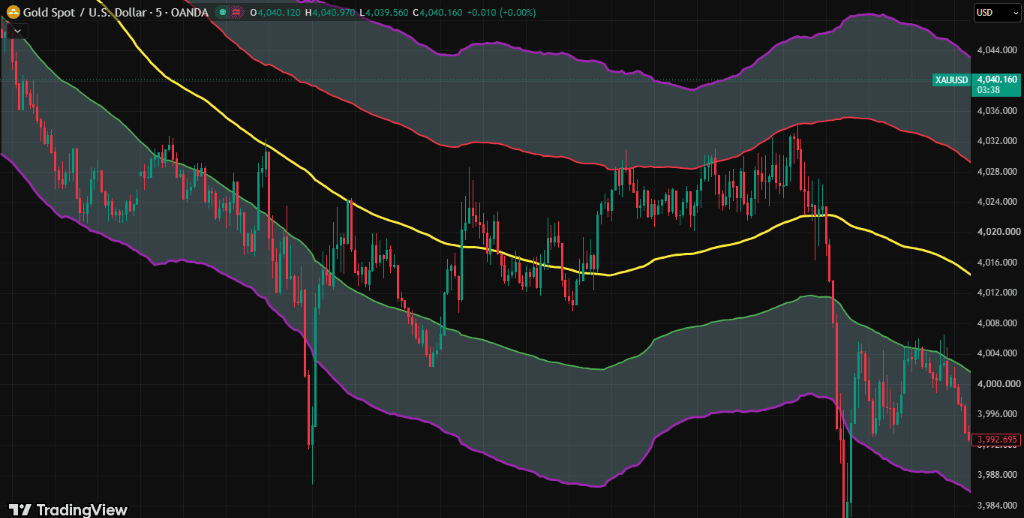
Central yellow baseline with inner red/green boundaries and outer purple deviation envelopes on XAUUSD 5m.
A Multi-Layered Range Framework Built for Clean Price Analysis
Unlike standard lagging oscillators or cluttered moving averages, NIMIC Algo provides a structured visual envelope directly on your TradingView chart. It decomposes market structure into a continuous baseline, inner reaction boundaries, and outer volatility extremes.
Dynamic Central Baseline
Serves as the structural equilibrium of the indicator. When price tracks above an ascending baseline, the market establishes bullish continuation; when price trades below, it reveals persistent distribution pressure.
Inner Reaction Channel
Dual reaction boundaries that outline normal trading range boundaries. The inner green line highlights dynamic support within trending moves, while the upper red line marks immediate structural resistance.
Outer Volatility Envelopes
The outer boundaries mark statistical deviation extremes. When aggressive market momentum drives price into the purple envelope, it highlights overextended conditions and potential exhaustion points.
Shaded Volatility Cloud
A dark translucent envelope that dynamically widens during volatile breakouts and narrows during tight consolidation, helping you spot volatility transitions before entering trades.
Transparent Methodology — No Fabricated Claims
NIMIC Algo is an analytical framework designed to assist visual chart interpretation across forex, commodities, crypto, and equities. We do not promise automated win-rates, guaranteed profits, or algorithmic magic. You receive the complete, uncompiled Pine Script code so you can inspect every calculation yourself.
Understand Every NIMIC Algo Level
Know what each level represents, from potential reversal opportunities to profit targets and outer-zone boundaries.
UPPER ZONE BOUNDARY
Defines the upper limit of the trading zone. When price reaches either violet boundary, it indicates a potential zone-out condition, where the market moves beyond the defined trading zone.
BUY REVERSAL LEVEL
Identifies a potential buy entry when price reaches the red line and reverses upward. It also serves as TP2, the final target for sell trades.
TARGET 1 (TP1)
Represents the intermediate profit target for both buy and sell trades, positioned between the red and green reversal levels.
SELL REVERSAL LEVEL
Identifies a potential sell entry when price reaches the green line and reverses downward. It also serves as TP2, the final target for buy trades.
LOWER ZONE BOUNDARY
Defines the lower limit of the trading zone. When price reaches either violet boundary, it indicates a potential zone-out condition, where the market moves beyond the defined trading zone.
NIMIC Algo levels illustrate potential market scenarios and trade-management reference points. They do not guarantee reversals, target attainment, or profitability. Always evaluate market conditions and manage risk appropriately.
Everything You Need to Chart With Confidence
Engineered for clarity, personal assistance, and true source code ownership without recurring subscription fees.
Visual Price-Range Framework
Continuous envelope modeling based on a core midline and multi-tier reaction bands. Observe immediate support, dynamic resistance, and volatility expansion directly on the chart.
Complete Source Code Included
You receive the full Pine Script source code delivered directly to your email after verification. No black-box indicators, closed locks, or hidden licensing backdoors.
Native TradingView Integration
Built specifically for the TradingView platform. Works seamlessly on any asset class (crypto, forex, indices, commodities) across both free and paid TradingView accounts.
One-on-One Setup Assistance
Get personal walkthrough guidance to install the script into your TradingView Pine Editor, configure inputs, and understand how the band levels react on your favorite charts.
Daily Customer Support (9 AM–6 PM)
Dedicated technical support available 7 days a week, from 9:00 AM to 6:00 PM IST. Get prompt help with chart setup, indicator customization, and trading view questions.
One-Time Purchase — No Subscription
Pay $194.25 USD once and own the indicator forever. No recurring credit card charges, no monthly renewal fees, and no surprise lockouts.
NIMIC Algo in the Market
Explore illustrative market indications captured from TradingView charts to see how NIMIC Algo presents market conditions through its visual range-based framework.
Methodological Notice: Screenshots are illustrative examples of indicator output, not investment advice or a guarantee of future performance. Market conditions change, and trading involves risk. All charts displayed represent historical examples and are not real-time or live market feeds.
Range Equilibrium & Multi-Boundary Framing
Price structure fluctuating within the structured multi-layered framework. The yellow baseline establishes continuous equilibrium while the inner red ceiling and lower green floor outline immediate boundaries.
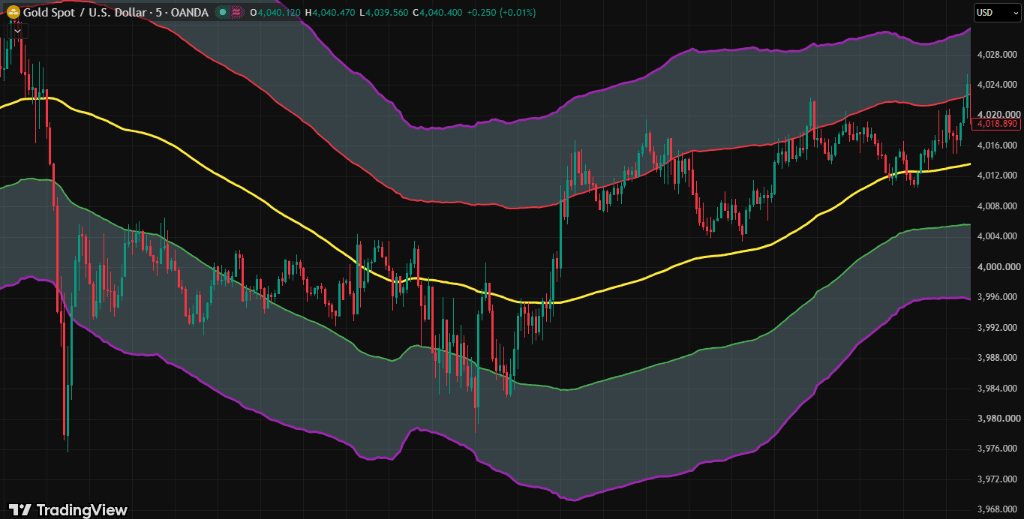
Lower Zone Reaction & Equilibrium Recovery
Price extends into the lower violet boundary zone before printing an upward reaction, recovering through the inner green line and traversing back toward the yellow baseline.
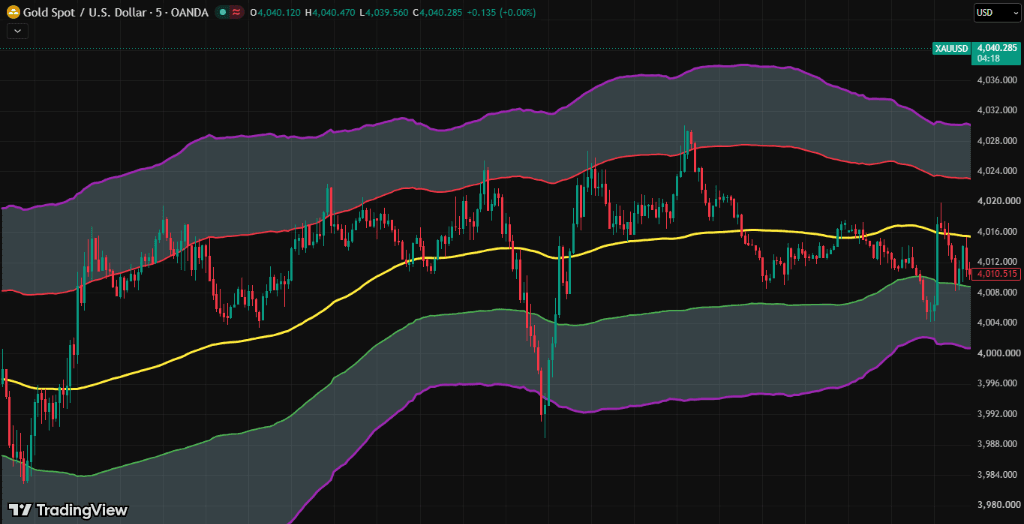
Ascending Baseline & Structural Midline Support
During sustained upward price flow, the ascending curvature of the yellow baseline visually aligns with higher lows, offering dynamic structural reference for pullbacks.
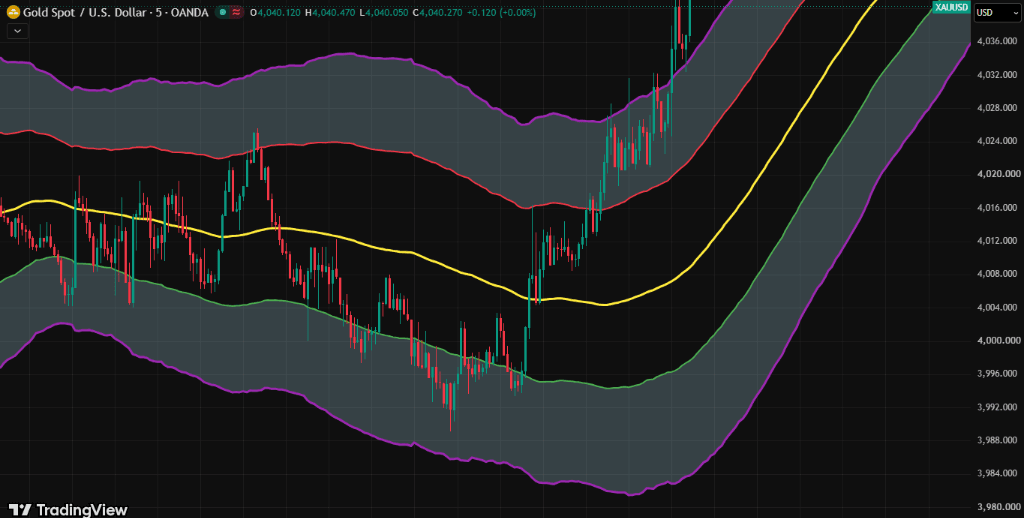
Volatility Expansion & Range Breakout Momentum
A sharp rally breaks through the red boundary line and travels along the expanding upper violet line as the band envelope widens dramatically.
How the Purchase & Delivery Journey Works
From initial registration to direct source code dispatch, each step is transparent, secure, and administrator-verified.
Explore the Indicator
Inspect the chart screenshots and understand how the dynamic baseline and volatility envelopes model price ranges.
Register Your Details
Enter your full name, TradingView username, phone number, and primary email address in the secure purchase form.
Scan UPI QR Code
A dedicated payment modal opens with your exact payable amount (USD $194.25 / configured ₹18,500 INR or discounted) and dynamic UPI QR.
Submit Payment Reference
Complete the payment in your preferred UPI banking app (GPay, PhonePe, Paytm, etc.) and enter your 12-digit UTR transaction ID.
Administrator Verification
Our operations team matches your submitted UTR against incoming merchant credits to authenticate your payment.
Source Code Delivery (Within 2 Hours)
Upon verification, your complete Pine Script source code will be sent via email within 2 hours with full setup instructions.
Verification Notice: Because this version uses manual UPI payment, our administrator verifies the bank transaction records before approving your order. Once verified, your source code is immediately dispatched to your registered email address.
One Single Tier. Full Source Code Ownership.
No monthly renewals, no tier lockouts, and no surprises. One upfront payment grants permanent access and direct personal assistance.
NIMIC Algo Full Access
Fixed conversion rate applied for manual UPI settlement (USD $194.25 = ₹18,500 INR)
What is included with your purchase:
Personal Assistance, When You Need It.
We believe a premium trading tool is only as effective as your understanding of it. Every NIMIC Algo purchase includes direct, one-on-one setup guidance to ensure you feel confident navigating its framework.
One-on-One Personal Guidance
Step-by-step assistance with pasting the Pine Script into your TradingView editor, adding it to charts, and customizing inputs to match your workflow.
Every Day from 9:00 AM to 6:00 PM IST
Our technical support desk is active 7 days a week during standard trading sessions to answer configuration questions and troubleshoot chart behaviors.
Genuine Human Technicians
Communicate with real specialists who understand Pine Script, indicator calculations, and chart setup.
Operating Schedule
Every day, 9:00 AM – 6:00 PM IST
Email Inquiries
support@nimic.inIdeal for detailed installation logs, order verification questions, or source code inquiries.
Direct Chat Support
Connect on TelegramQuick messaging for real-time setup guidance during active hours.
Everything You Need to Know
Straightforward answers regarding product capabilities, one-time payment, UPI settlement, and source code delivery.